Key Performance Indicators
Economic and financial data
Revenues
-
M€
EBITDA
-
M€
EBIT
-
M€
Net financial position
-
M€| Economic results (thousands euros) |
2024 | 2023 | 2022 |
|---|---|---|---|
| REVENUES | 1.407.121 | 1,657,858 | 1,728,280 |
| EBITDA | 415.095 | 289,464 | 295,281 |
| EBIT | 325.839 | 211,613 | 236,187 |
| Group Net Result | 213.240 | 157,834 | 163,975 |
| Balance Sheet (thousands euros) |
2024 | 2023 | 2022 |
|---|---|---|---|
| Net invested Capital | 1.654.343 | 1.640.301 | 1.192.894 |
| Shareholders’ equity attributable to the Group | 1.168.519 | 1.125.171 | 869.985 |
| Total shareholders’ equity | 1.205.145 | 1.146.751 | 878.873 |
| Net Debt | 575.788 | 499.746 | 314.021 |
Production, supply, and distribution
Green Pipelines
-
Generated Energy
-
GWh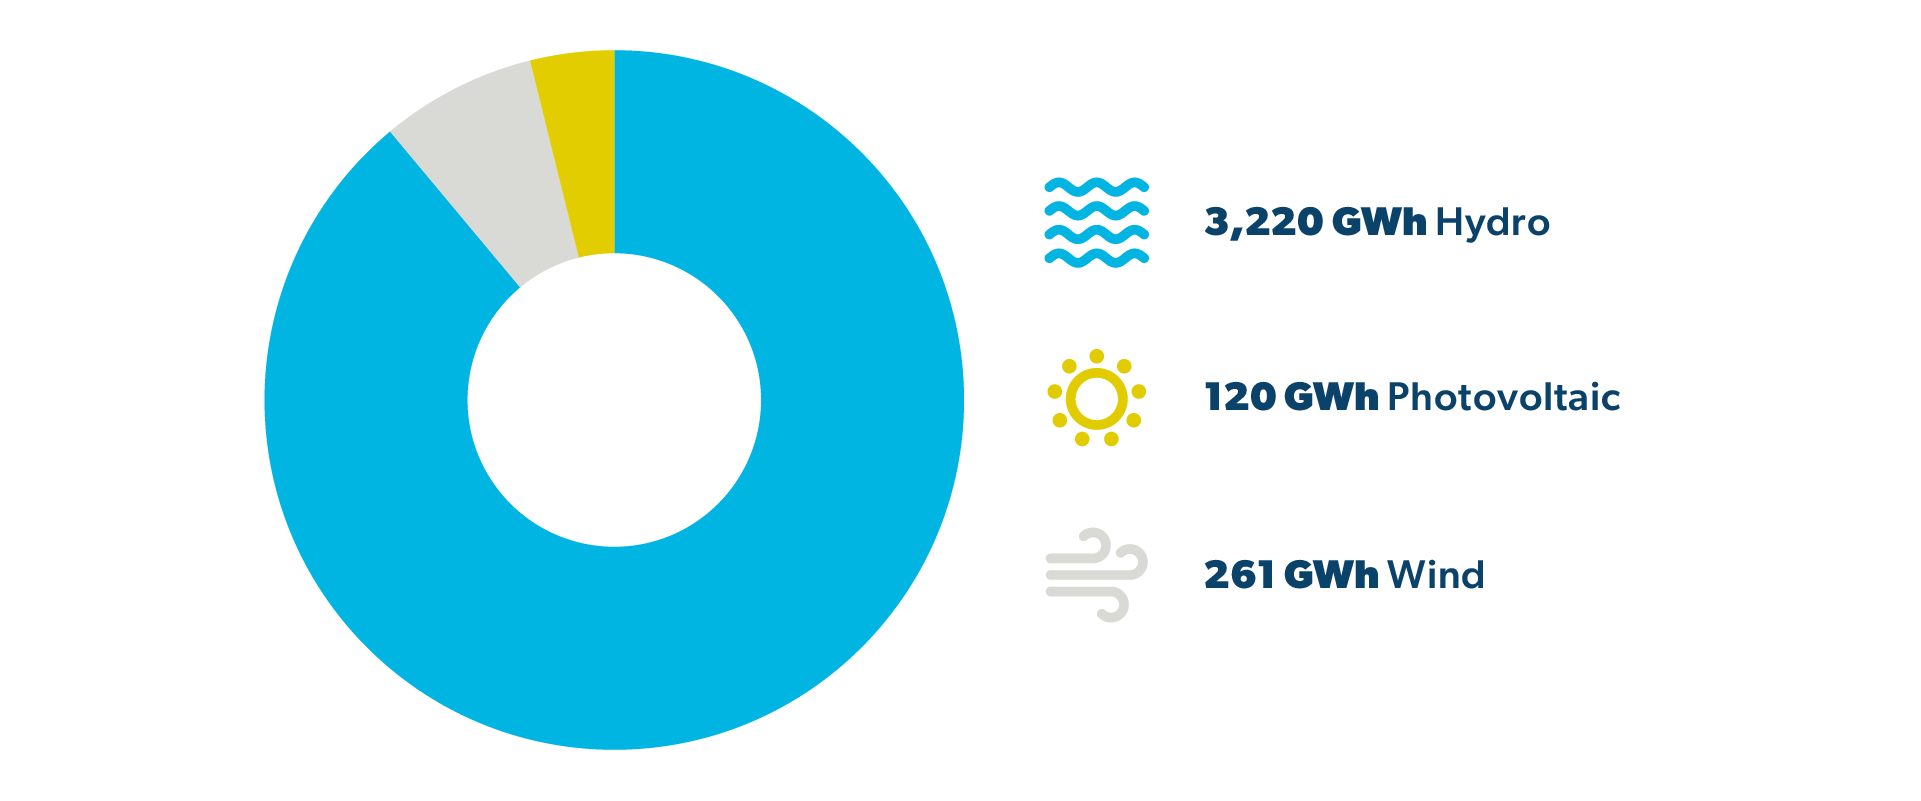
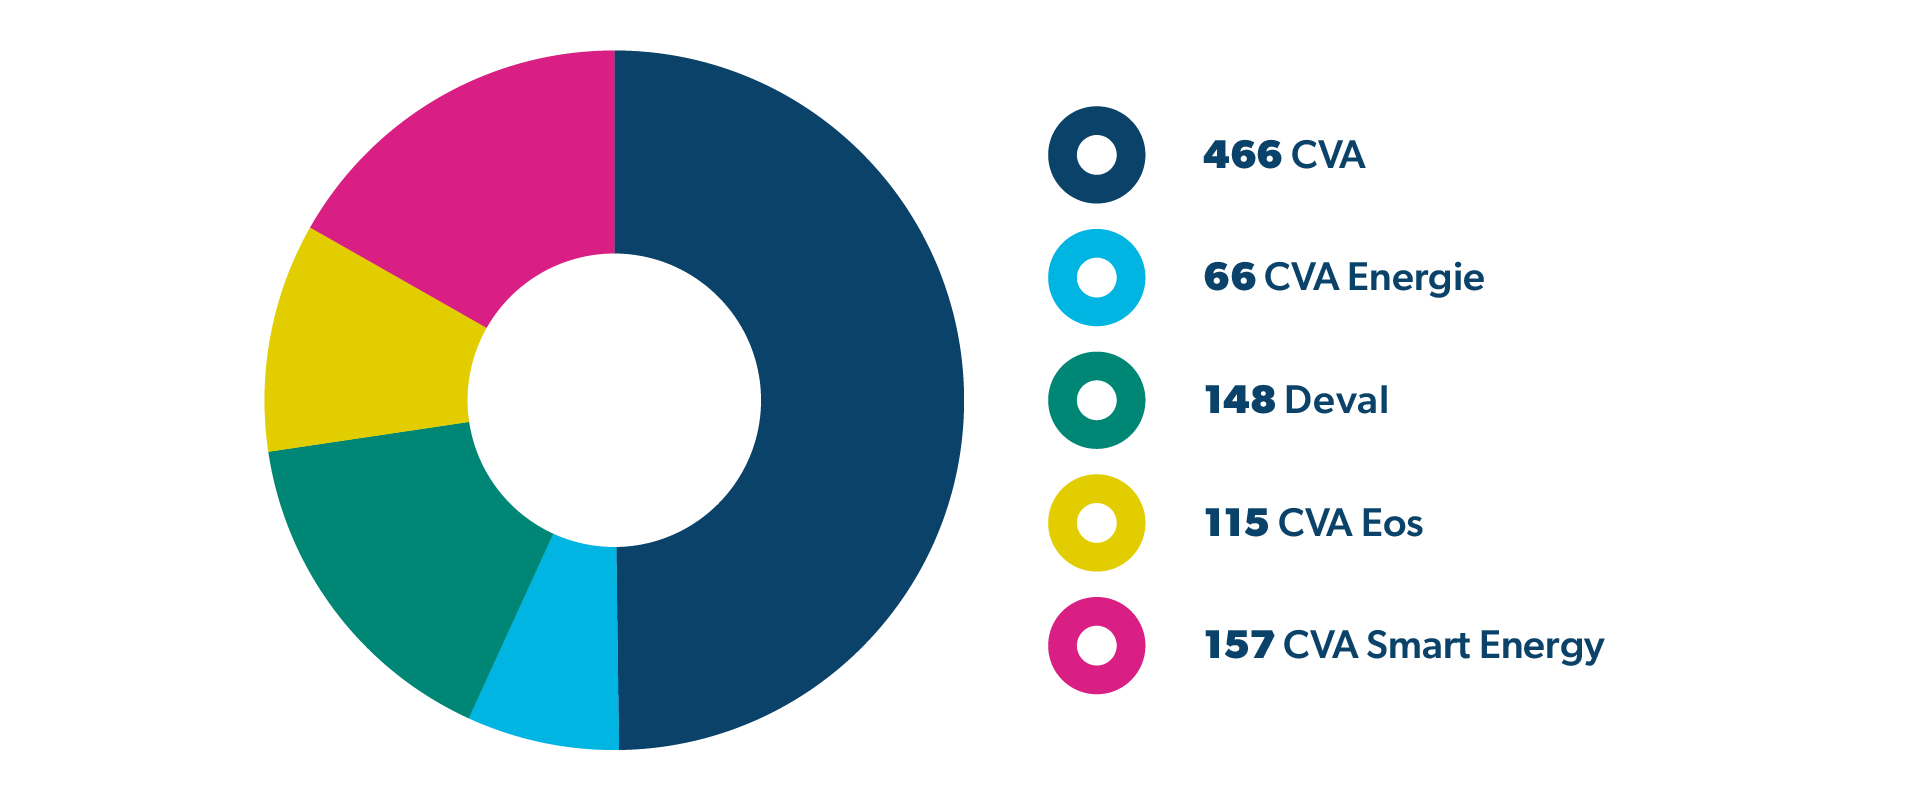
Supplied Energy
-
GWh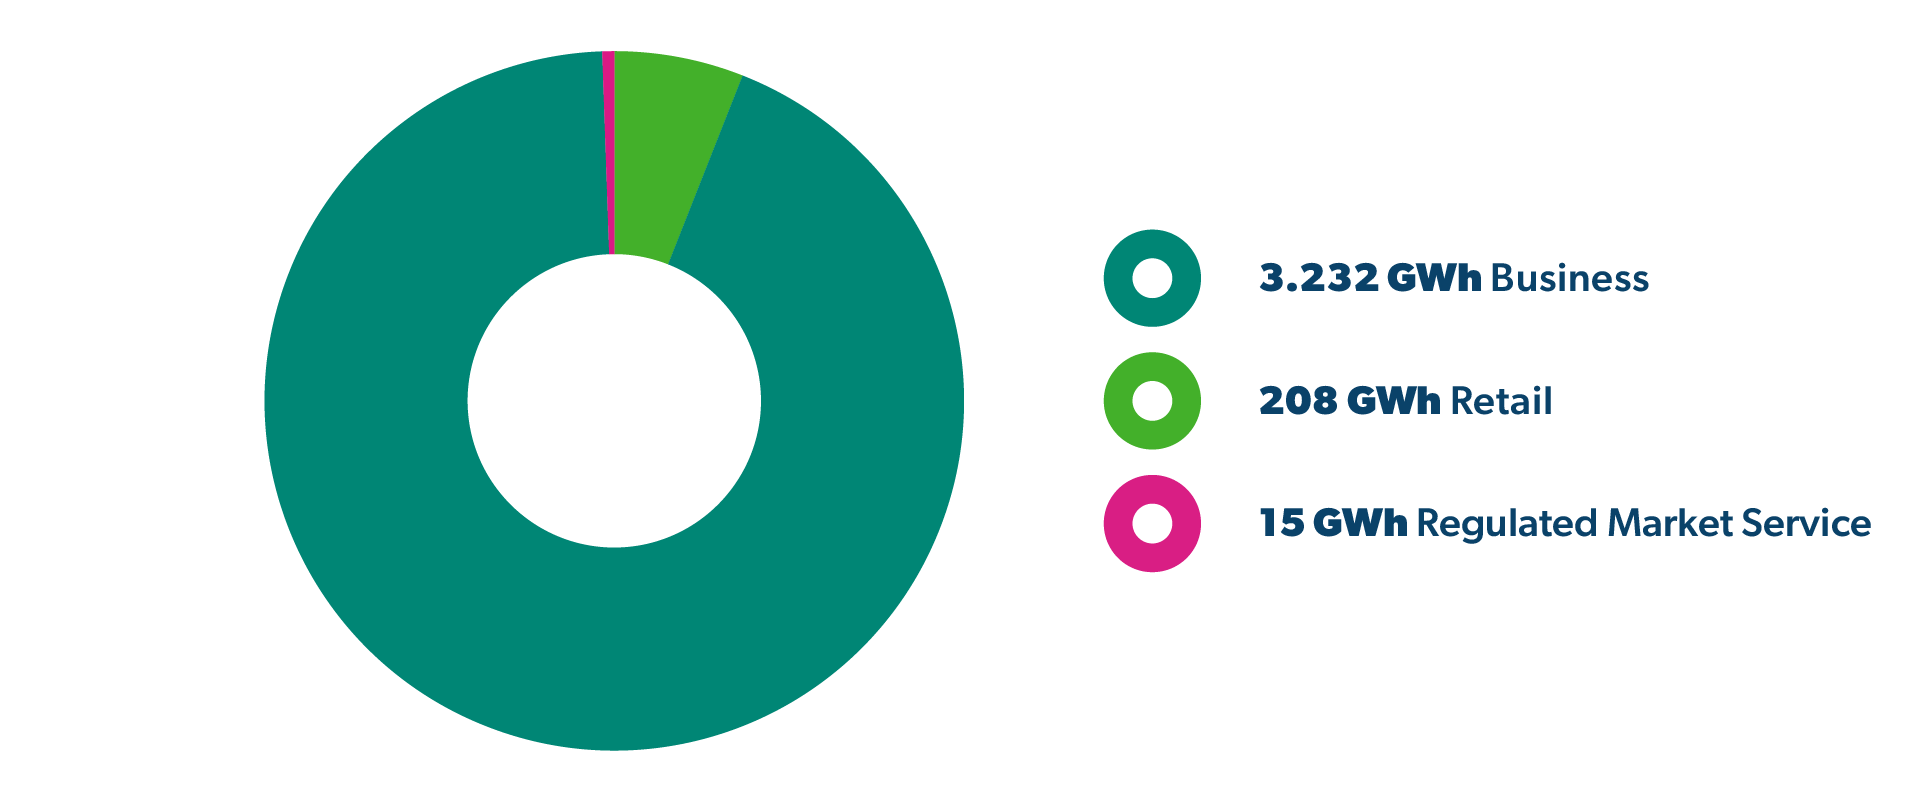
Distributed Energy
-
GWh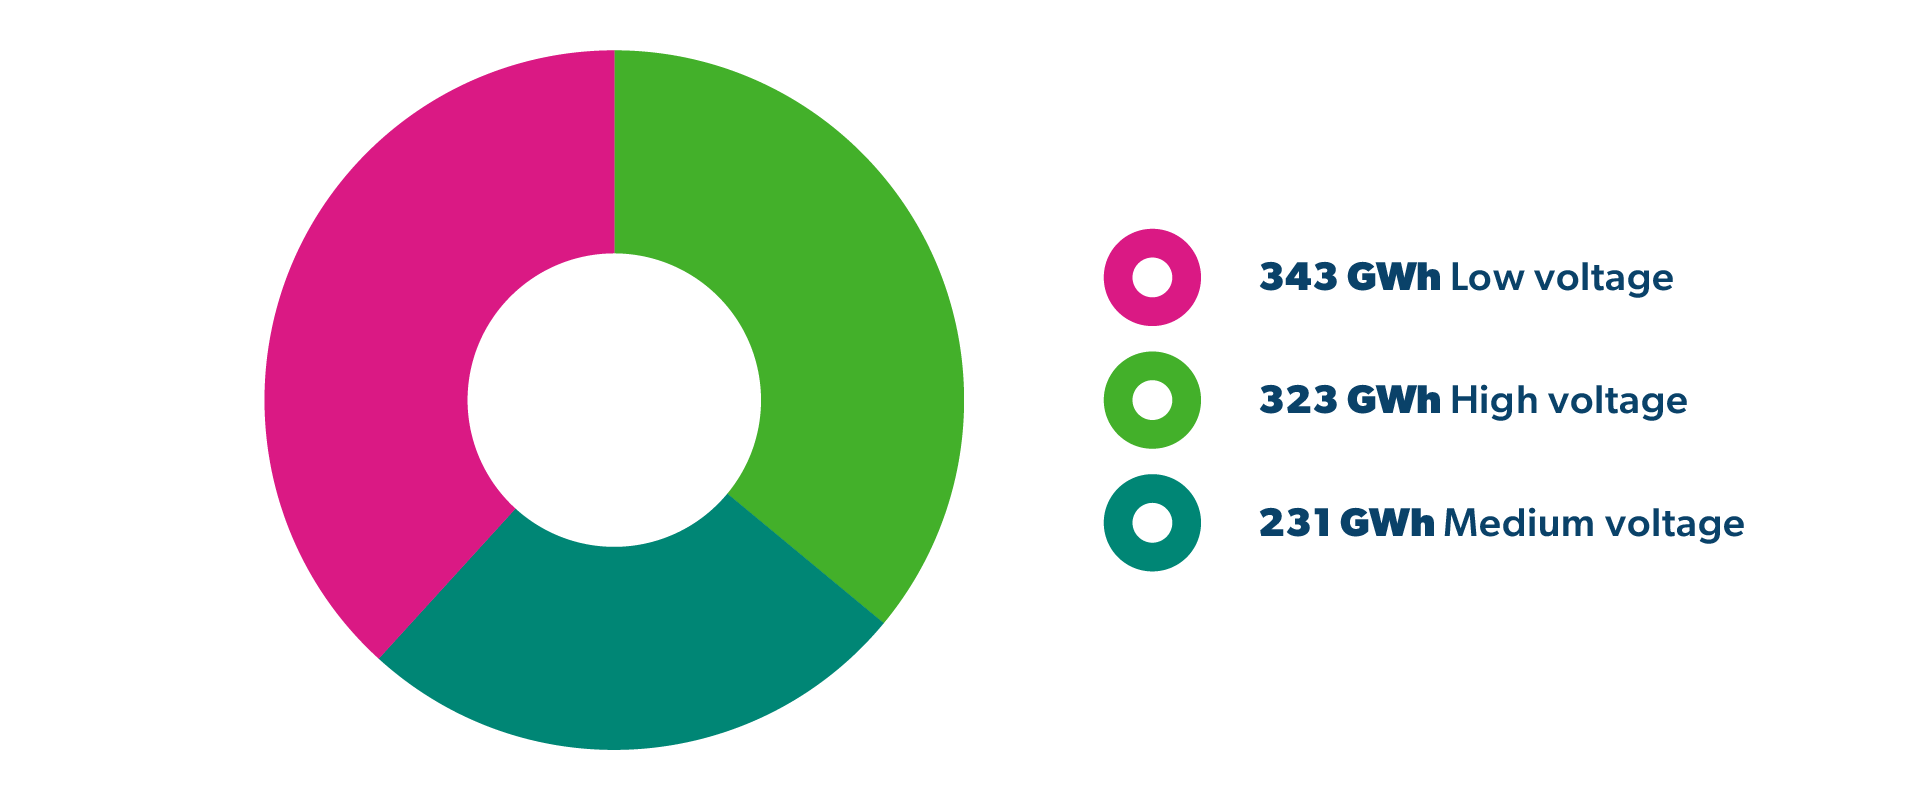
Renewable capacity*
-
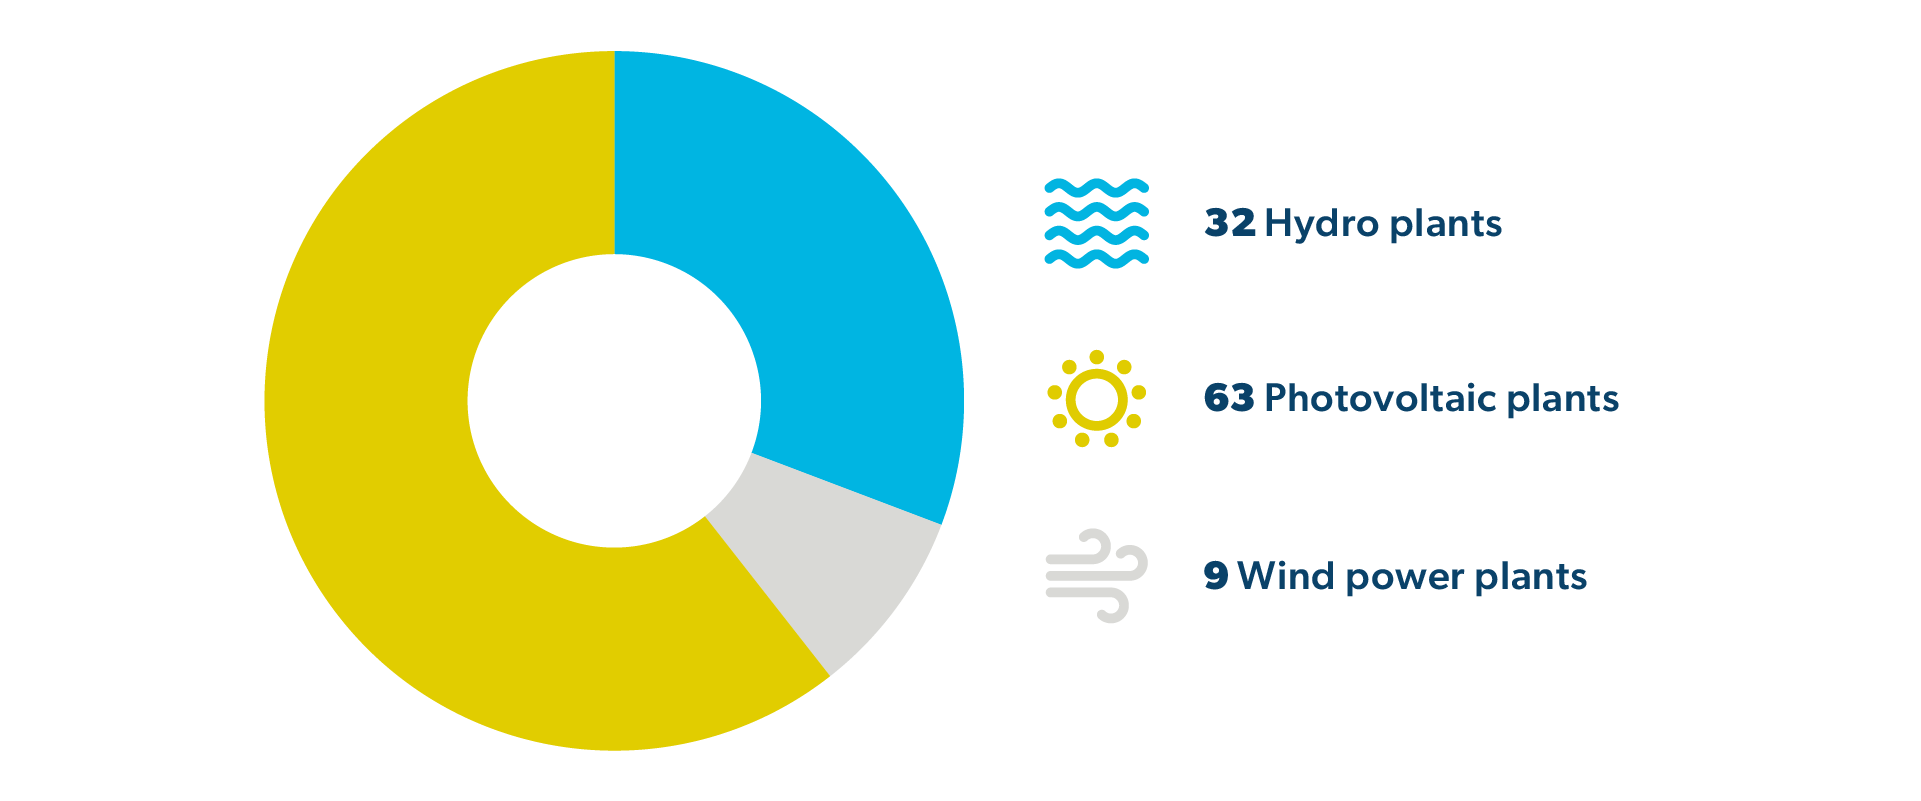
MWGeographical distribution of installed capacity
| SOURCE | REGION | PLANTS | POWER (MW) |
|---|---|---|---|
| Wind | Basilicata | 1 | 40 |
| Campania | 1 | 38 | |
| Lazio | 1 | 42 | |
| Apulia | 4 | 66 | |
| Tuscany | 1 | 8 | |
| Aosta Valley | 1 | 3 | |
| Total Wind | 9 | 197 | |
| Photovoltaic | Emilia Romagna | 1 | 1 |
| Lazio | 6 | 41 | |
| Lombardy | 12 | 22 | |
| Marche | 1 | 1 | |
| Piedmont | 7 | 28 | |
| Apulia | 25 | 25 | |
| Sardinia | 4 | 8 | |
| Tuscany | 1 | 1 | |
| Umbria | 3 | 3 | |
| Aosta Valley | 2 | 0** | |
| Veneto | 1 | 4 | |
| Total Photovoltaic | 63 | 134 | |
| Hydroelectric | Piedmont | 1 | 23 |
| Aosta Valley | 31 | 913 | |
| Total Hydroelectric | 32 | 936 | |
| OVERALL TOTAL | 104 | 1,267 |
*of which 22 MW not yet in operation
**rounding of 0.2 MW
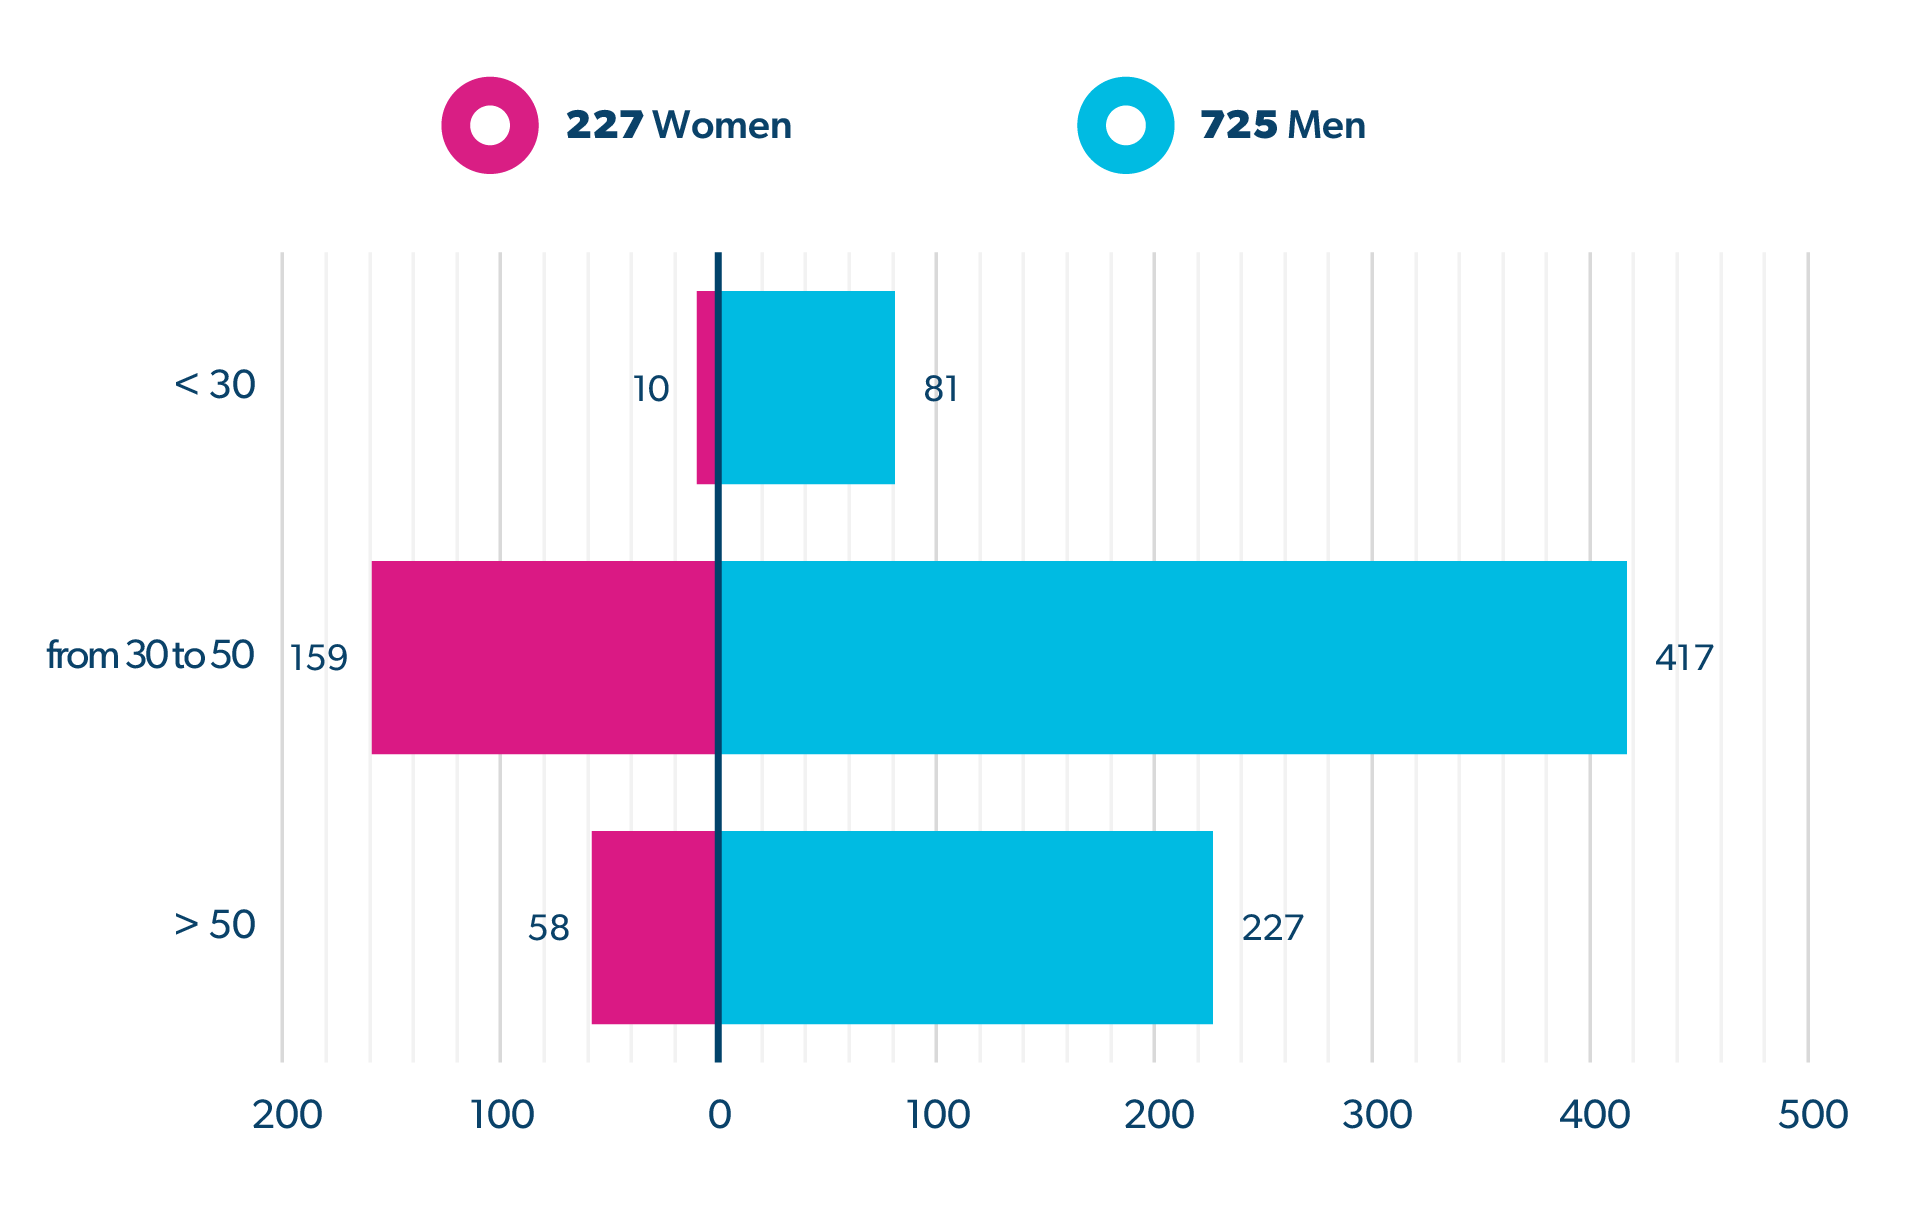
Human Resources
Number of resources of the CVA Group
-
CVA Group | Breakdown by age range and gender